


How To Run an Agile Death March


Found on the Internet...
An experienced scrum master describes their work cycles (screen capture) as going "from being very busy during sprint end/start weeks to be [sic] very bored." While this scrum master works very hard to fill in the gaps with 1:1's with the team members and providing regular training opportunities, they nonetheless ask the question, "Does anyone have any suggestions of things I am maybe not doing that I should be doing?" One response (screen capture) included the following:
"Now, it could be that you have worked to create a hyper-performing team and there is no further room for improvement. A measure of this is that velocity (or similar metric) has increased by an order of magnitude in the last year.
However, the most likely scenario is that you and your team have become 'comfortable' and velocity has not increased significantly in the last few Sprints and/or there is a high variance in velocity."
This reflects a common misunderstanding of "velocity" and its confusion with "acceleration." (It also reflects the "more is better" and "winners vs losers" thinking derived from the scrum sports metaphor and points as a way of keeping score. I've written about that elsewhere.) Neither does the commenter understand what "order of magnitude" means. A velocity that increases by an order of magnitude in a year isn't a velocity, it's an acceleration. That's a bad thing. This wouldn't be a "hyper-performing" team. This would be a team headed for a crash as a continual acceleration in story points completed is untenable. More and more points each sprint isn't the goal of scrum. A product owner cannot predict when their team might complete a feature or a project if the delivery of work is accelerating throughout the project.
Assuming a typical project, something that continues for a year or more, the team and the project will eventually crash as they've been pressured to work more and more hours and cut more and more corners in the interests of completing more and more points. The accumulation of bugs, small and large, will slow progress. Team fatigue will increase and moral decrease, resulting in turn-over and further delays. In common parlance, this is referred to as a "death march."
Strictly speaking, velocity is some displacement over time. In the case of scrum, it is the number of story points completed in a sprint. We've "displace" some number of story points from being "not done" to "done." By itself, a single sprint's velocity isn't particularly useful. Looking at the velocity of a number of successive sprints, however, is useful. There are two pieces of information from looking at successive sprint velocities that, when considered together, can reveal useful aspects of how well a team is performing or not. The first is the average over the previous 5 to 8 sprints, a rolling average. As a yard stick, this can provide a measure of predictability. Using this average, a product owner can make a rough calculation for how many sprints remain before completing components or the project based on the story point information in the product backlog.
The measure of confidence for this prediction would come from an analysis of the variance demonstrated in the sprint velocity values over time. Figures 1 and 2 show the distinction between the value provided by a rolling average and the value provided by the variance in values over time.
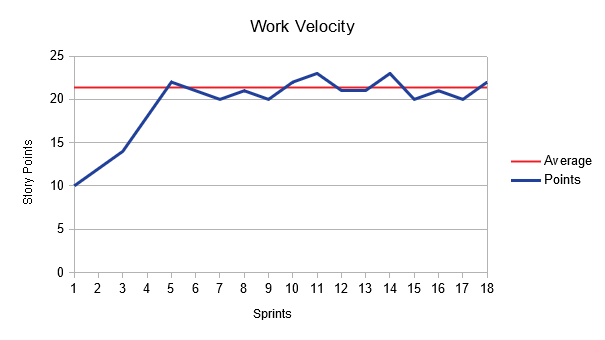
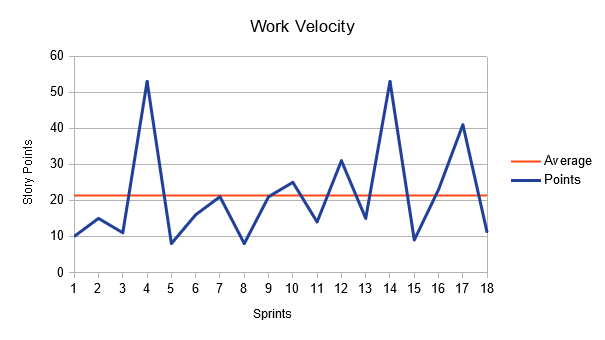
In both cases the respective teams have an average velocity of 21 points per sprint. However, the variability in the values over time show that the team in Figure 1 would have a much higher level of confidence in any predictions based on their past performance than the team shown in Figure 2.
What matters is the trend, each sprint's velocity over a number of sprints. The steady completion of story points (i.e. work) sprint to sprint is the desirable goal. Another way to say this is that a steady velocity makes it possible to predict project delivery dates. In real life, there will be a variance (up and down) of sprint velocity over time and the goal is to guide the project such that this variance is within a manageable range.
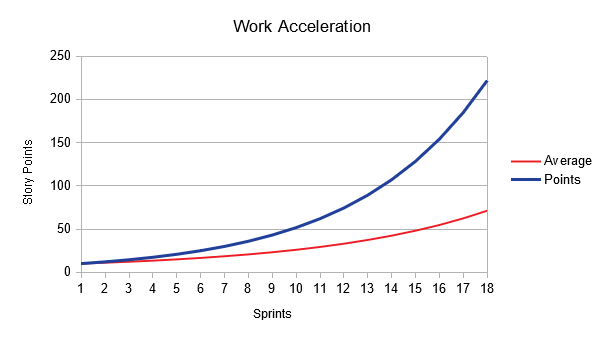
If a team were to set as its goal an increase in the number of story points completed from sprint to sprint then their performance chart might initially look like Figure 3.
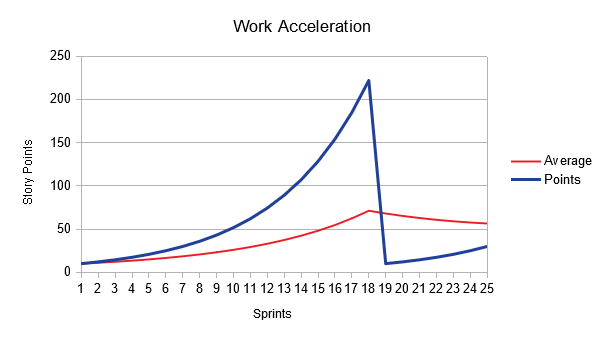
Such a pace is unsustainable and eventually the team burns out. Fatigue, decreased moral, and overall dissatisfaction with the project cause team members to quit and progress grinds to a halt. The fallout of such a collapse is likely to include the buildup of significant technical debt and code errors as the run-up to the crescendo forced team members to cut corners, take shortcuts, and otherwise compromise the quality of their effort. The resulting performance chart would look something like Figure 4.
All that said, I grant that there is merit in coaching teams to make reasonable improvements in their overall sprint performance. An increase in the overall average velocity might be one way to measure this. However, to press the team into achieving an order of magnitude increase in performance is a fools errand and more than likely to end in disaster for the team and the project.