
Agile Metrics - Time (Part 3 of 3)

In Part 1 of this series, we set the frame for how to use time as a metric for assessing Agile team and project health. In Part 2, we looked at shifts in the cross-over point between burn-down and burn-up charts. In Part 3, we'll look at other asymmetries and anomalies that can appear in time burn-down/burn-up charts and explore the issues the teams may be struggling with under these circumstances.
Figure 1 shows a burn-up that by the end of the sprint significantly exceeded the starting value for the original estimate.
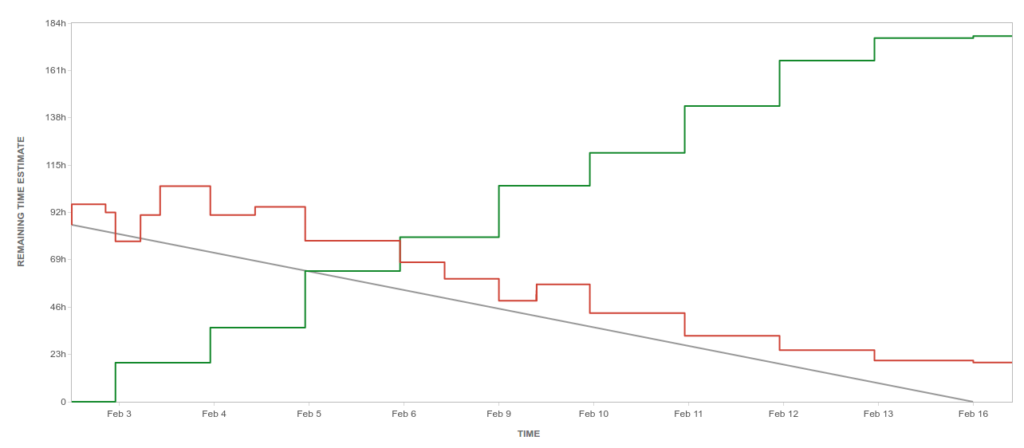
There isn't much mystery around a chart like this. The time needed to complete the work was significantly underestimated. The mystery is in the why and what that led to this situation.
